 Mixing
Macon County, Tennessee
Macon County, Tennessee | ||
|---|---|---|
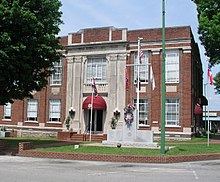 Macon County Courthouse in Lafayette | ||
| ||
Location in the U.S. state of Tennessee | ||
 Tennessee's location in the U.S. | ||
| Founded | 1842 | |
| Named for | Nathaniel Macon[1] | |
| Seat | Lafayette | |
| Largest city | Lafayette | |
| Area | ||
| • Total | 307 sq mi (795 km2) | |
| • Land | 307 sq mi (795 km2) | |
| • Water | 0.1 sq mi (0 km2), 0.03% | |
| Population (est.) | ||
| • (2016) | 23,450 | |
| • Density | 72/sq mi (28/km2) | |
| Congressional district | 6th | |
| Time zone | Central: UTC−6/−5 | |
| Website | maconcountytn.gov | |

Macon County is a county located in the U.S. state of Tennessee. As of the 2010 census, the population was 22,248.[2] Its county seat is Lafayette.[3]
Macon County is part of the Nashville-Davidson–Mufreesboro–Franklin, TN Metropolitan Statistical Area.
Contents
1 History
2 Geography
2.1 Adjacent Counties
3 Demographics
3.1 2010 Census
3.2 2000 Census
4 Communities
4.1 Cities
4.2 Unincorporated communities
5 Politics
6 See also
7 References
8 External links
History

Old Galen Elementary School building near Lafayette
Macon County was formed in 1842 from parts of Smith and Sumner counties. It was named in honor of the late Revolutionary War veteran and United States Senator, Nathaniel Macon.[4] The county seat was named in honor of the Marquis de Lafayette.[1]
The county's second-largest city, Red Boiling Springs, thrived as a mineral springs resort in the late 19th and early 20th centuries. Three hotels from this period– the Donoho Hotel, the Thomas House Hotel (previously the Cloyd Hotel), and the Armour's Hotel (previously the Counts Hotel)– are still open, though only the Armour's still offers mineral water treatments.
Geography
According to the U.S. Census Bureau, the county has a total area of 307 square miles (800 km2), of which 307 square miles (800 km2) is land and 0.1 square miles (0.26 km2) (0.03%) is water.[5] The county is located amidst the northeastern Highland Rim, and is generally rugged and hilly.
Adjacent Counties
Monroe County, Kentucky (northeast)
Clay County (east)
Jackson County (southeast)
Smith County (south)
Trousdale County (southwest)
Sumner County (west)
Allen County, Kentucky (northwest)
Demographics
| Historical population | |||
|---|---|---|---|
| Census | Pop. | %± | |
| 1850 | 6,948 | — | |
| 1860 | 7,290 | 4.9% | |
| 1870 | 6,633 | −9.0% | |
| 1880 | 9,321 | 40.5% | |
| 1890 | 10,878 | 16.7% | |
| 1900 | 12,881 | 18.4% | |
| 1910 | 14,559 | 13.0% | |
| 1920 | 14,922 | 2.5% | |
| 1930 | 13,872 | −7.0% | |
| 1940 | 14,904 | 7.4% | |
| 1950 | 13,599 | −8.8% | |
| 1960 | 12,197 | −10.3% | |
| 1970 | 12,315 | 1.0% | |
| 1980 | 15,700 | 27.5% | |
| 1990 | 15,906 | 1.3% | |
| 2000 | 20,386 | 28.2% | |
| 2010 | 22,248 | 9.1% | |
| Est. 2016 | 23,450 | [6] | 5.4% |
| U.S. Decennial Census[7] 1790-1960[8] 1900-1990[9] 1990-2000[10] 2010-2014[2] | |||

Age pyramid Macon County[11]
2010 Census
As of the census of 2010[12], there were 22,248 people, 8,561 households, and 6,112 families residing in the county. The population density was 72 people per square mile (28/km²). There were 9,861 housing units at an average density of 32 per square mile (12/km²). The racial makeup of the county was 96.03% White, 0.42% Black or African American, 0.35% Native American, 0.20% Asian, 0.01% Pacific Islander, 1.96% from other races, and 1.04% from two or more races. 4.13% of the population were Hispanic or Latino of any race.
There were 8,561 households out of which 30.16% had children under the age of 18 living with them, 54.55% were married couples living together, 5.58% had a male householder with no wife present, 11.26% had a female householder with no husband present, and 28.61% were non-families. 24.27% of all households were made up of individuals and 10.86% had someone living alone who was 65 years of age or older. The average household size was 2.57 and the average family size was 3.02.
In the county, the population was spread out with 25.02% under the age of 18, 8.39% from 18 to 24, 31.59% from 25 to 44, 20.69% from 45 to 64, and 14.09% who were 65 years of age or older. The median age was 38.7 years. For every 100 females, there were 97.08 males. For every 100 females age 18 and over, there were 95.21 males.
2000 Census
As of the census[13] of 2000, there were 20,386 people, 7,916 households, and 5,802 families residing in the county. The population density was 66 people per square mile (26/km²). There were 8,894 housing units at an average density of 29 per square mile (11/km²). The racial makeup of the county was 97.86% White, 0.22% Black or African American, 0.42% Native American, 0.24% Asian, 0.07% Pacific Islander, 0.77% from other races, and 0.44% from two or more races. 1.71% of the population were Hispanic or Latino of any race.
There were 7,916 households out of which 35.00% had children under the age of 18 living with them, 60.70% were married couples living together, 8.80% had a female householder with no husband present, and 26.70% were non-families. 23.80% of all households were made up of individuals and 10.70% had someone living alone who was 65 years of age or older. The average household size was 2.55 and the average family size was 3.00.
In the county, the population was spread out with 26.10% under the age of 18, 8.50% from 18 to 24, 29.40% from 25 to 44, 23.30% from 45 to 64, and 12.70% who were 65 years of age or older. The median age was 36 years. For every 100 females, there were 97.40 males. For every 100 females age 18 and over, there were 95.10 males.
The median income for a household in the county was $29,867, and the median income for a family was $37,577. Males had a median income of $28,170 versus $20,087 for females. The per capita income for the county was $15,286. About 11.30% of families and 15.10% of the population were below the poverty line, including 17.00% of those under age 18 and 25.40% of those age 65 or over.
Communities
Cities
Lafayette (county seat)- Red Boiling Springs
Unincorporated communities
- Beech Bottom
- Beech Hill
- Enon
- Galen
- Hillsdale
- Willette
- Rocky Mound
- Siloam
Politics
| Year | Republican | Democratic | Third Parties |
|---|---|---|---|
2016 | 83.5% 6,263 | 14.3% 1,072 | 2.3% 169 |
2012 | 76.2% 5,260 | 22.5% 1,552 | 1.4% 93 |
2008 | 69.9% 5,145 | 28.0% 2,060 | 2.1% 155 |
2004 | 62.8% 4,670 | 36.8% 2,738 | 0.3% 25 |
2000 | 51.9% 3,366 | 47.1% 3,059 | 1.0% 66 |
1996 | 48.0% 2,481 | 43.4% 2,240 | 8.6% 445 |
1992 | 40.2% 2,299 | 51.7% 2,961 | 8.1% 466 |
1988 | 65.4% 2,962 | 33.9% 1,538 | 0.7% 31 |
1984 | 65.2% 3,330 | 34.2% 1,747 | 0.6% 28 |
1980 | 59.0% 2,925 | 39.3% 1,947 | 1.8% 89 |
1976 | 50.9% 2,063 | 48.2% 1,951 | 0.9% 37 |
1972 | 75.7% 2,295 | 21.5% 653 | 2.8% 85 |
1968 | 58.0% 2,173 | 14.2% 530 | 27.8% 1,041 |
1964 | 56.1% 1,846 | 43.9% 1,446 | |
1960 | 74.8% 2,829 | 24.2% 915 | 1.0% 38 |
1956 | 67.0% 2,207 | 32.4% 1,069 | 0.6% 20 |
1952 | 69.2% 2,602 | 30.8% 1,158 | |
1948 | 68.1% 1,708 | 29.4% 738 | 2.6% 64 |
1944 | 76.3% 2,322 | 23.0% 701 | 0.7% 22 |
1940 | 70.8% 1,730 | 29.1% 711 | 0.2% 4 |
1936 | 61.2% 1,402 | 38.3% 876 | 0.5% 12 |
1932 | 55.7% 1,123 | 43.9% 885 | 0.5% 10 |
1928 | 82.2% 1,937 | 17.8% 419 | |
1924 | 72.0% 1,808 | 27.4% 689 | 0.6% 15 |
1920 | 75.0% 3,208 | 24.9% 1,066 | 0.1% 2 |
1916 | 62.0% 1,600 | 38.0% 980 | |
1912 | 56.1% 1,251 | 35.3% 787 | 8.7% 194 |
Although part of the Middle Tennessee Grand Division, Macon County is geographically firmly a part of Kentucky’s Pennyroyal Plateau and has much more historically in common with adjacent Bluegrass State counties like Monroe, Clinton and Cumberland. Those Pennyroyal counties were overwhelmingly opposed to secession[15] and most of its residents fought their Civil War in Union blue rather than Confederate gray. Consequently, after the Civil War, Macon County became an isolated powerfully Republican County in then-Democratic Middle Tennessee. Since 1884, the only Democratic presidential candidate to carry Macon County has been Bill Clinton in 1992, when he had Tennessee Senator Al Gore – who lived in neighbouring Smith County as a child – as his running mate. In the 2000 election, Gore’s local popularity was sufficient to give him the third-highest Democratic percentage of the past 132 years despite losing the state, but since then like all of Appalachia and surrounding regions the county has shown an extremely rapid trend to the Republican Party due to powerful opposition to the Democratic Party’s liberal views on social issues.[16]
In other statewide elections, Macon County has shown a similar rapid Republican trend. It voted for a Democratic Senator as recently as the 2002 election, when Bob Clement defeated Lamar Alexander by a mere nineteen votes,[17] but for the last three senatorial elections the Democratic candidate has not obtained more than 22.09 percent of the county’s vote. Although Phil Bredesen carried the county in both 2002 and 2006, he is the last Democratic gubernatorial candidate to top thirty percent.
See also
- National Register of Historic Places listings in Macon County, Tennessee
References
^ ab Martha Carver, "Macon County," Tennessee Encyclopedia of History and Culture. Retrieved: 11 March 2013.
^ ab "State & County QuickFacts". United States Census Bureau. Archived from the original on July 14, 2011. Retrieved December 6, 2013..mw-parser-output cite.citation{font-style:inherit}.mw-parser-output q{quotes:"""""""'""'"}.mw-parser-output code.cs1-code{color:inherit;background:inherit;border:inherit;padding:inherit}.mw-parser-output .cs1-lock-free a{background:url("//upload.wikimedia.org/wikipedia/commons/thumb/6/65/Lock-green.svg/9px-Lock-green.svg.png")no-repeat;background-position:right .1em center}.mw-parser-output .cs1-lock-limited a,.mw-parser-output .cs1-lock-registration a{background:url("//upload.wikimedia.org/wikipedia/commons/thumb/d/d6/Lock-gray-alt-2.svg/9px-Lock-gray-alt-2.svg.png")no-repeat;background-position:right .1em center}.mw-parser-output .cs1-lock-subscription a{background:url("//upload.wikimedia.org/wikipedia/commons/thumb/a/aa/Lock-red-alt-2.svg/9px-Lock-red-alt-2.svg.png")no-repeat;background-position:right .1em center}.mw-parser-output .cs1-subscription,.mw-parser-output .cs1-registration{color:#555}.mw-parser-output .cs1-subscription span,.mw-parser-output .cs1-registration span{border-bottom:1px dotted;cursor:help}.mw-parser-output .cs1-hidden-error{display:none;font-size:100%}.mw-parser-output .cs1-visible-error{font-size:100%}.mw-parser-output .cs1-subscription,.mw-parser-output .cs1-registration,.mw-parser-output .cs1-format{font-size:95%}.mw-parser-output .cs1-kern-left,.mw-parser-output .cs1-kern-wl-left{padding-left:0.2em}.mw-parser-output .cs1-kern-right,.mw-parser-output .cs1-kern-wl-right{padding-right:0.2em}
^ "Find a County". National Association of Counties. Retrieved 2011-06-07.
^ Gannett, Henry (1905). The Origin of Certain Place Names in the United States. U.S. Government Printing Office. p. 195.
^ "2010 Census Gazetteer Files". United States Census Bureau. August 22, 2012. Retrieved April 9, 2015.
^ "Population and Housing Unit Estimates". Retrieved June 9, 2017.
^ "U.S. Decennial Census". United States Census Bureau. Retrieved April 9, 2015.
^ "Historical Census Browser". University of Virginia Library. Retrieved April 9, 2015.
^ Forstall, Richard L., ed. (March 27, 1995). "Population of Counties by Decennial Census: 1900 to 1990". United States Census Bureau. Retrieved April 9, 2015.
^ "Census 2000 PHC-T-4. Ranking Tables for Counties: 1990 and 2000" (PDF). United States Census Bureau. April 2, 2001. Retrieved April 9, 2015.
^ Based on 2000 census data
^ Bureau, U.S. Census. "American FactFinder - Community Facts". factfinder.census.gov. Retrieved 2018-03-11.
^ "American FactFinder". United States Census Bureau. Retrieved 2011-05-14.
^ Leip, David. "Dave Leip's Atlas of U.S. Presidential Elections". uselectionatlas.org. Retrieved 2018-03-11.
^ Copeland, James E.; ‘Where Were the Kentucky Unionists and Secessionists’; The Register of the Kentucky Historical Society, volume 71, no. 4 (October, 1973), pp. 344-363
^ Cohn, Nate; ‘Demographic Shift: Southern Whites’ Loyalty to G.O.P. Nearing That of Blacks to Democrats’, New York Times, April 24, 2014
^ Dave Leip’s U.S. Election Atlas; 2002 Senatorial General Election Results – Macon County, TN
External links
| Wikimedia Commons has media related to Macon County, Tennessee. |
- Official site
- Macon County Chamber of Commerce
- Tennessee Central Economic Alliance for Macon County
Macon County at Curlie
Macon County, TNGenWeb - free genealogy resources for the county
Places adjacent to Macon County, Tennessee | ||||||||||
|---|---|---|---|---|---|---|---|---|---|---|
| ||||||||||
Municipalities and communities of Macon County, Tennessee, United States | ||
|---|---|---|
County seat: Lafayette | ||
| Cities |
| |
| Unincorporated communities |
| |
Nashville metropolitan area | ||
|---|---|---|
| Principal City |
| |
| Other Major Cities |
| |
| Counties |
| |
Nashville (capital) | ||
| Topics |
|  Seal of Tennessee |
| Grand Divisions |
| |
| Regions |
| |
| Largest cities |
| |
| Counties |
| |
Coordinates: 36°32′N 86°01′W / 36.53°N 86.01°W / 36.53; -86.01


Comments
Post a Comment