 Mixing
Kilmarnock and Loudoun (Scottish Parliament constituency)
| Kilmarnock and Loudoun | |
|---|---|
| Former county constituency for the Scottish Parliament | |
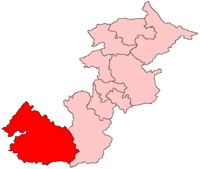 | |
 Kilmarnock and Loudoun shown within the Central Scotland electoral region and the region shown within Scotland | |
| Former constituency | |
| Created | 1999 |
| Abolished | 2011 |
| Council area | East Ayrshire (part) |
| Replaced by | Kilmarnock and Irvine Valley |
Kilmarnock and Loudoun was a constituency of the Scottish Parliament (Holyrood). It elected one Member of the Scottish Parliament (MSP) by the plurality (first past the post) method of election.
From the 2011 Scottish Parliament election Kilmarnock and Loudoun was redrawn and renamed Kilmarnock and Irvine Valley.
Contents
1 Electoral region
2 Constituency boundaries and council area
3 Boundary review
4 Member of the Scottish Parliament
5 Election results
5.1 2007 Parliamentary election
5.2 2003 Parliamentary election
5.3 1999 Parliamentary election
6 Footnotes
7 External links
Electoral region
The region covered all of the Falkirk council area, all of the North Lanarkshire council area, part of the South Lanarkshire council area, part of the East Ayrshire council area and a small part of the East Dumbartonshire council area.
Constituency boundaries and council area
The constituency was created at the same time as the Scottish Parliament, in 1999, with the name and boundaries of an existing Westminster (House of Commons) constituency.[1] The Westminster constituency was created during the period of local government regions and districts, 1975 to 1996, when there was a Kilmarnock and Loudoun district of the Strathclyde region. In 1996 regions and districts were replaced with unitary council areas. Scottish Westminster constituencies were mostly replaced with new constituencies in 2005.[2]
The Holyrood constituency covers a northern portion of the East Ayrshire council area. The rest of the East Ayrshire area is covered by Carrick, Cumnock and Doon Valley, which also covers a southern portion of the South Ayrshire council area. Carrick, Cumnock and Doon Valley is within the South of Scotland electoral region.
Boundary review
See Scottish Parliament constituencies and regions from 2011
Following their First Periodic review into constituencies to the Scottish Parliament in time for the 2011 elections, the Boundary Commission for Scotland recommended the creating of a new seat to be known as Kilmarnock and Irvine Valley
This new creation is formed by the Kilmarnock, Annick, and Irvine Valley electoral areas of East Ayrshire.
Member of the Scottish Parliament
| Election | Member | Party |
|
|---|---|---|---|
1999 |
Margaret Jamieson |
Labour |
|
2003 |
|||
2007 |
Willie Coffey |
Scottish National Party |
|
2011 |
Constituency abolished; see Kilmarnock and Irvine Valley |
||
Election results
2007 Parliamentary election
Scottish Parliament election, 2007: Kilmarnock and Loudoun[3][4] | |||||||||
|---|---|---|---|---|---|---|---|---|---|
| Notes: |
Blue background denotes the winner of the electorate vote. |
||||||||
| Party |
Candidate |
Votes |
% |
±% |
Party votes |
% |
±% |
||
SNP |
Willie Coffey |
14,297 |
42.76 |
+6.52 |
12,147 |
36.31 |
+9.04 |
||
Labour |
12,955 |
38.75 |
-1.33 |
12,146 |
36.31 |
-0.93 |
|||
Conservative |
Janette McAlpine |
4,127 |
12.34 |
+1.89 |
3,894 |
11.64 |
+0.22 |
||
Liberal Democrats |
Ron Aitken |
2,056 |
6.15 |
+1.17 |
1,643 |
4.91 |
-1.01 |
||
Scottish Green |
|
820 |
2.45 |
-1.89 |
|||||
Scottish Senior Citizens |
|
721 |
2.16 |
-2.08 |
|||||
Solidarity |
|
430 |
1.29 |
+1.29 |
|||||
BNP |
|
400 |
1.20 |
+1.20 |
|||||
Scottish Christian |
|
258 |
0.77 |
+0.77 |
|||||
Socialist Labour |
|
240 |
0.72 |
-0.96 |
|||||
| Publican Party |
159 |
0.47 |
+0.47 |
||||||
Scottish Socialist |
|
155 |
0.46 |
-5.21 |
|||||
Christian Peoples |
|
140 |
0.41 |
+0.41 |
|||||
| NHSFirst |
119 |
0.36 |
+0.36 |
||||||
UKIP |
|
94 |
0.28 |
+0.07 |
|||||
Scottish Unionist |
|
83 |
0.25 |
-0.15 |
|||||
| Informal votes |
1,018 |
1,004 |
|||||||
Total Valid votes |
33,435 |
33,449 |
|||||||
Turnout |
34,453 |
56.68 |
|||||||
SNP gain from Labour |
Majority |
1,342 |
4.0 |
||||||
2003 Parliamentary election
Scottish Parliament election, 2003: Kilmarnock and Loudoun[5][6] | |||||||||
|---|---|---|---|---|---|---|---|---|---|
| Notes: |
Blue background denotes the winner of the electorate vote. |
||||||||
| Party |
Candidate |
Votes |
% |
±% |
Party votes |
% |
±% |
||
Labour |
12,633 |
40.08 |
-4.00 |
11,736 |
37.24 |
+0.03 |
|||
SNP |
Daniel Coffey |
11,423 |
36.24 |
-0.83 |
8,595 |
27.28 |
-6.41 |
||
Conservative |
Robin Traquair |
3,296 |
10.46 |
-1.20 |
3,599 |
11.42 |
-0.96 |
||
Liberal Democrats |
Ian Gibson |
1,571 |
4.98 |
-2.21 |
1,867 |
5.93 |
-0.96 |
||
Scottish Socialist |
Colin Rutherford |
1,421 |
4.51 |
+4.51 |
1,789 |
5.68 |
+4.11 |
||
Independent |
Mary Anderson |
404 |
1.28 |
+1.28 |
183 |
0.58 |
+0.58 |
||
Independent |
Matthew Donnelly |
402 |
1.28 |
+1.28 |
|||||
Scottish People's |
Lyndsay McIntosh |
371 |
1.18 |
+1.18 |
314 |
1.00 |
+1.00 |
||
Scottish Green |
|
1,368 |
4.34 |
+1.15 |
|||||
Scottish Senior Citizens |
|
1,336 |
4.24 |
+4.24 |
|||||
Socialist Labour |
|
530 |
1.68 |
-1.51 |
|||||
Scottish Unionist |
|
124 |
0.40 |
-0.09 |
|||||
UKIP |
|
68 |
0.22 |
+0.22 |
|||||
| Informal votes |
185 |
172 |
|||||||
Total Valid votes |
31,520 |
31,509 |
|||||||
Turnout |
31,705 |
51.93 |
|||||||
Labour hold |
Majority |
1,210 |
3.84 |
||||||
N.B. Turnout for regional list was 31,681 votes
1999 Parliamentary election
Scottish Parliament election, 1999: Kilmarnock and Loudoun | |||||||||
|---|---|---|---|---|---|---|---|---|---|
| Notes: |
Blue background denotes the winner of the electorate vote. |
||||||||
| Party |
Candidate |
Votes |
% |
±% |
Party votes |
% |
±% |
||
Labour |
Margaret Jamieson |
17,345 |
44.08 |
14,649 |
37.22 |
||||
SNP |
Alex Neil |
14,585 |
37.07 |
13,259 |
33.69 |
||||
Conservative |
Lyndsay McIntosh |
4,589 |
11.66 |
4,874 |
12.38 |
||||
Liberal Democrats |
John Stewart |
2,830 |
7.19 |
2,713 |
6.89 |
||||
Socialist Labour |
|
1,256 |
3.19 |
||||||
Scottish Green |
|
788 |
2.00 |
||||||
Independent - Dennis Canavan |
632 |
1.61 |
|||||||
Scottish Socialist |
|
618 |
1.57 |
||||||
Scottish Unionist |
|
190 |
0.48 |
||||||
ProLife Alliance |
|
122 |
0.31 |
||||||
Natural Law |
|
88 |
0.22 |
||||||
| Others |
170 |
0.43 |
|||||||
Total Valid votes |
39,349 |
39,189 |
|||||||
Labour win new seat |
Majority |
2,760 |
7.01 |
||||||
Footnotes
^ See Kilmarnock and Loudoun (UK Parliament constituency).
^ See The 5th Periodical Report of the Boundary Commission for Scotland Archived 2007-09-21 at the Wayback Machine..
^ Regional votes 2007
^ Constituency votes 2007
^ Regional results 2003
^ Constituency votes 2003
External links
- Constituency website


Comments
Post a Comment